Ocelo
ES Sign in Let’s talk

Product

The whole life cycle of a vision model, in one platform

Eight steps in the browser, from the first photos to a model monitored on the line. At each one, Ocelo applies what works best today and explains why, so you reach a state-of-the-art result sooner.

Steps 1 and 2 · Data and annotation

Label the way your quality team works

Images arrive as folders, through the API or from another system, and the originals are never modified. Annotation is built for experts: keyboard shortcuts for everything and one-click object selection.

  • Five tasks: classification, multi-label, detection, instance segmentation and semantic segmentation.
  • Smart select with SAM 2.1 and pre-labeling with your own models, always reviewed by a person.
  • Tasks per annotator, review, consensus and measured agreement between annotators.
  • The history of every label: who changed it and when.
Label screen of a detection project: a wooden board with knots, resin and a crack marked with boxes Label screen of an instance segmentation project: the outlines of a run of dropped stitches and of a hole on a fabric photo Label screen of a semantic segmentation project: the mask of a crack on a concrete photo Projects screen: six projects for wood, concrete, fabrics, a packing line and circuit boards
Real screenshot: defect detection on wood, with a box and a class for each defect.

Step 3 · Data diagnostics

Data problems, caught before training

Many models fail because of the data, not the algorithm. Ocelo checks the dataset with dozens of analyses and gives a readiness score, with each finding explained and a link to review it. Here are some of them, exactly as they come out in the example projects.

  • Duplicate or near-identical images, including across training and test.
  • Suspicious labels, and shortcuts the model could quietly learn.
  • Blurry, dark or unusual images.
  • A locked test set, so the metric stays honest.
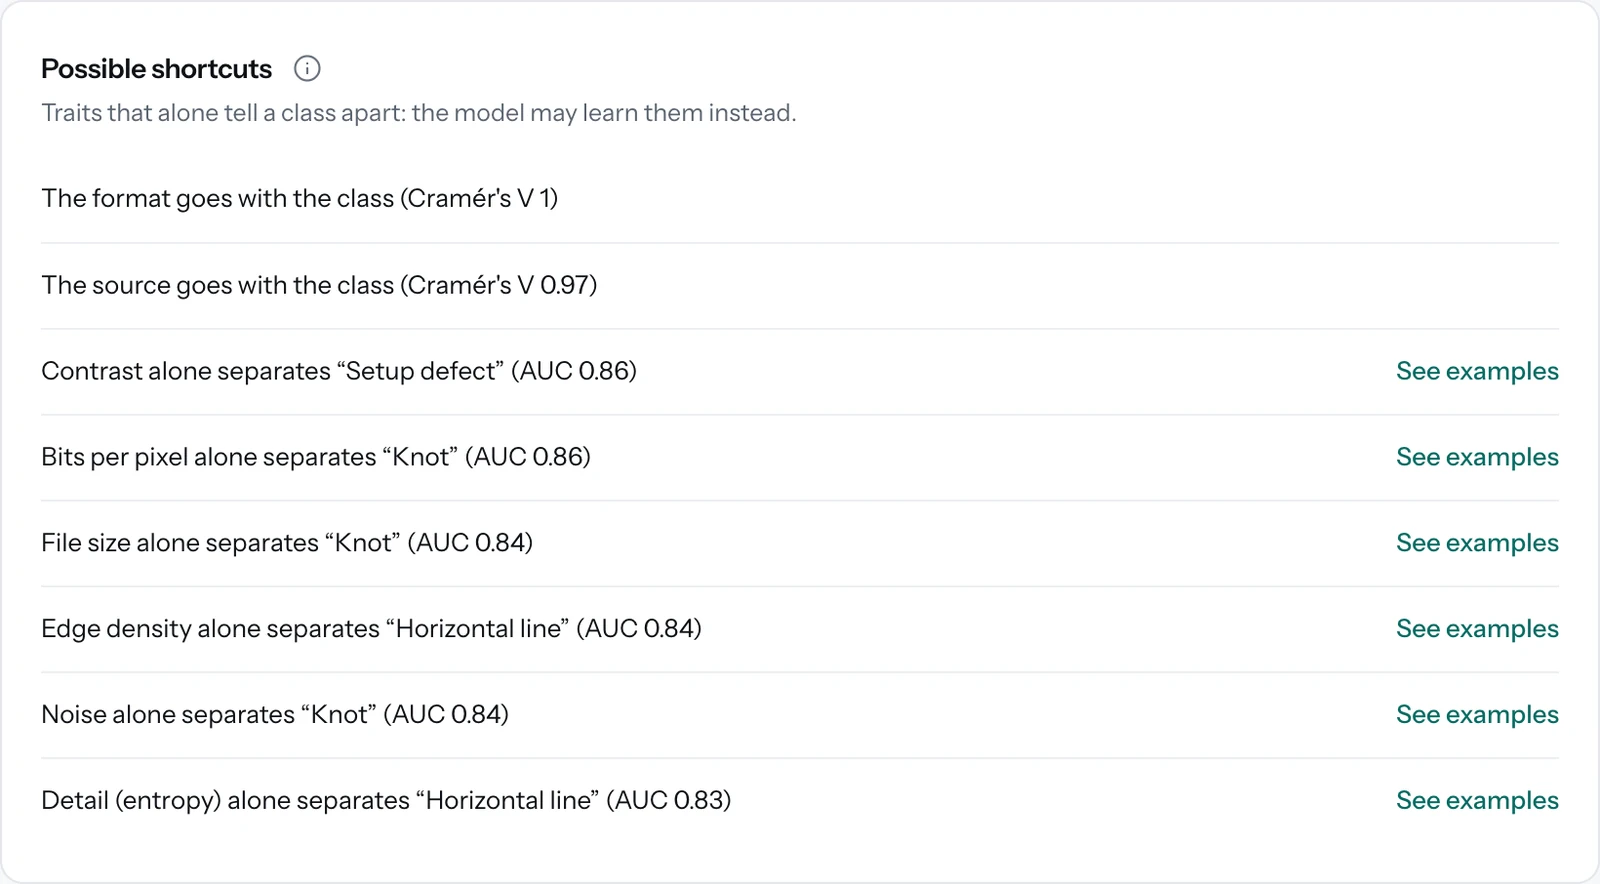
Possible shortcuts list: the format and the origin go with the class, and several image measures separate a class on their own
Shortcuts the model could learnThe file format and the factory go with the class, and contrast alone already separates one defect: the model could learn that instead of the defect.
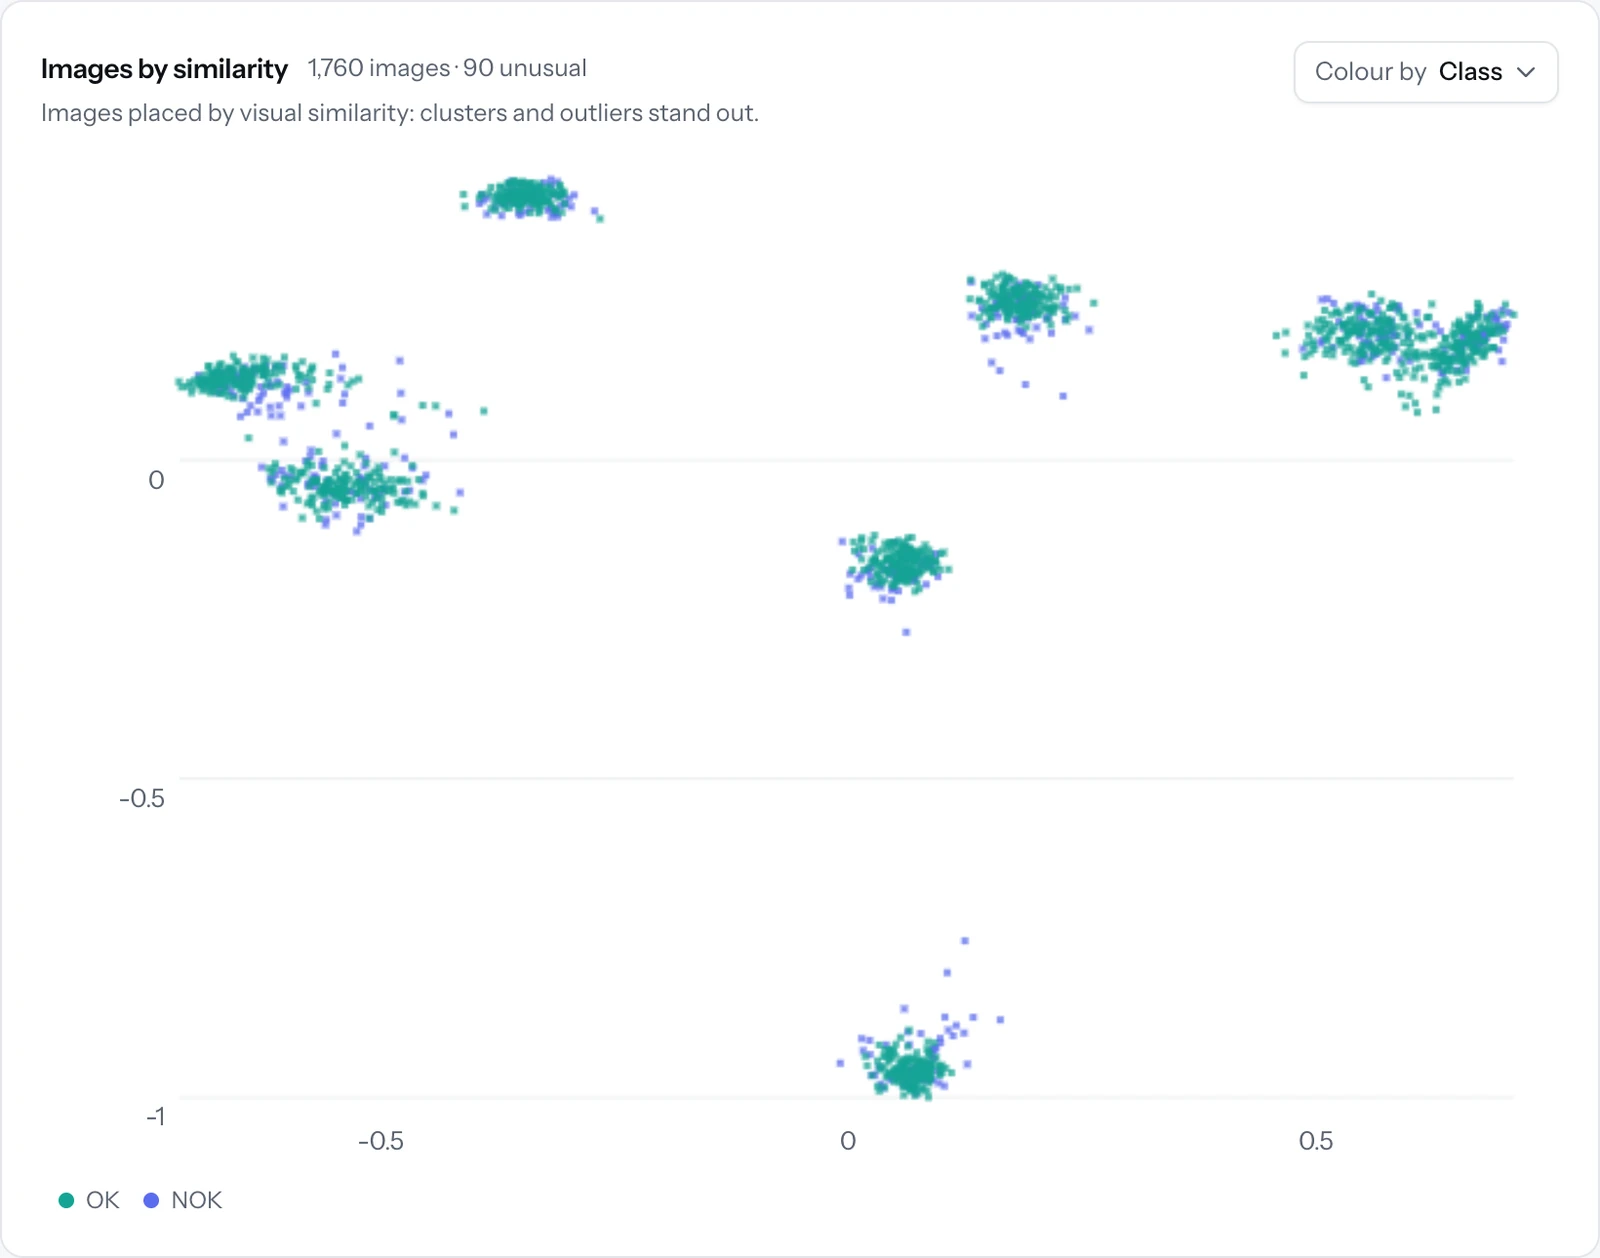
Similarity map: separate point clouds, one per product, with good and defective parts in different colors
Similarity map1,760 images of eight products: each cluster is a product, and the stray points are unusual images.
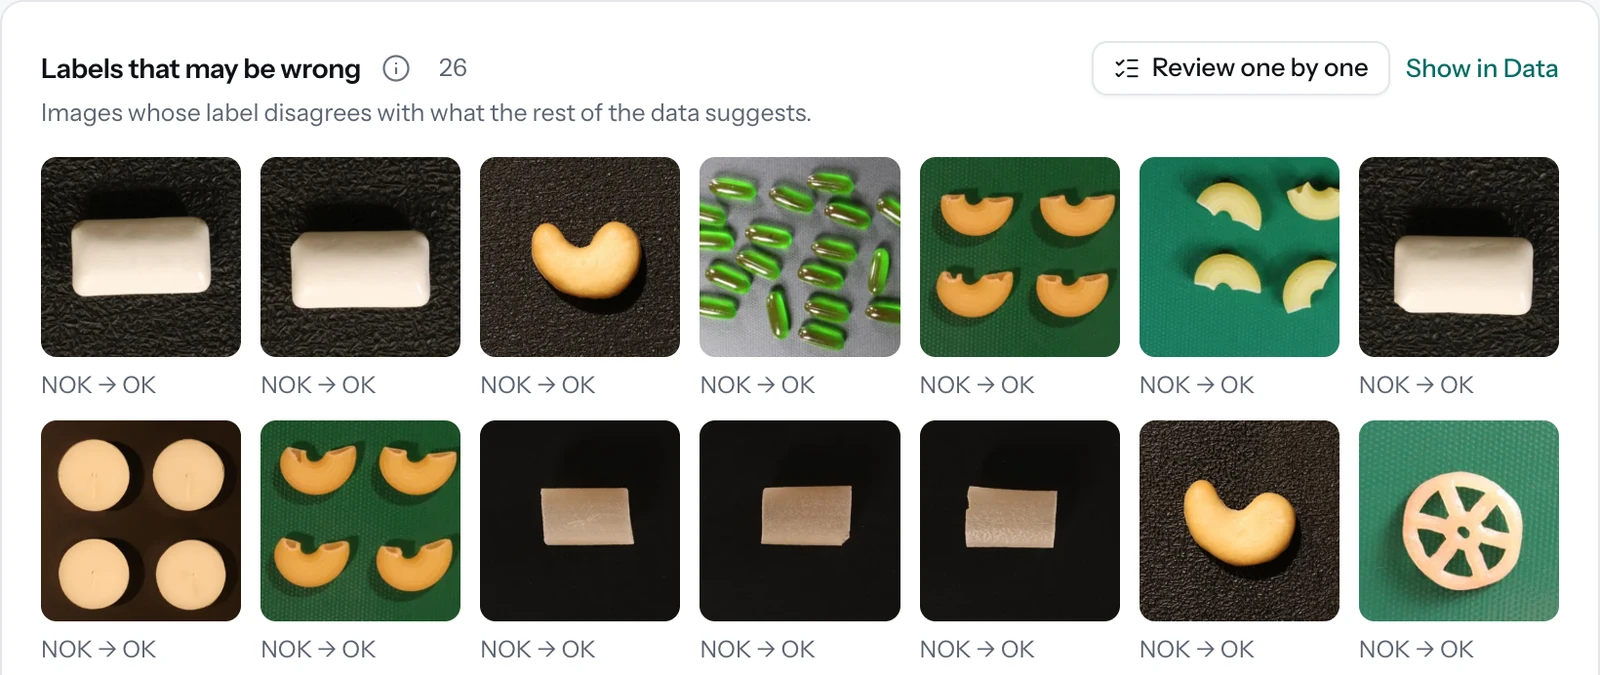
Labels that may be wrong: thumbnails of products labeled NOK that the check suggests reviewing as OK
Labels that may be wrongImages whose label does not match their look-alikes', to review one by one before training.
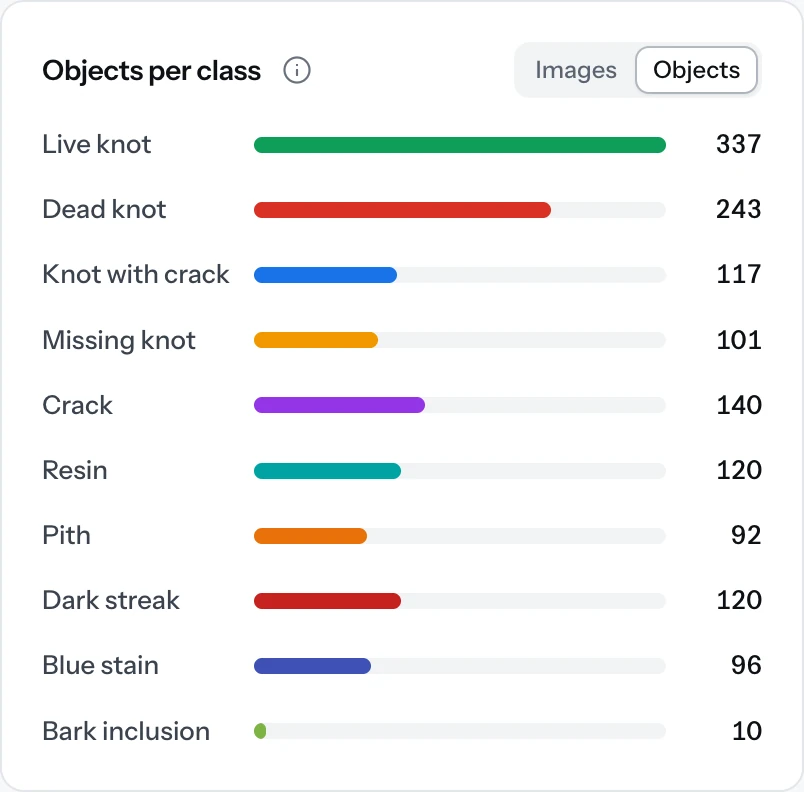
Bars of objects per wood defect class, from 338 live knots to 10 bark inclusions
Unbalanced classes338 live knots against 10 bark inclusions: Ocelo warns before training and suggests how to compensate.
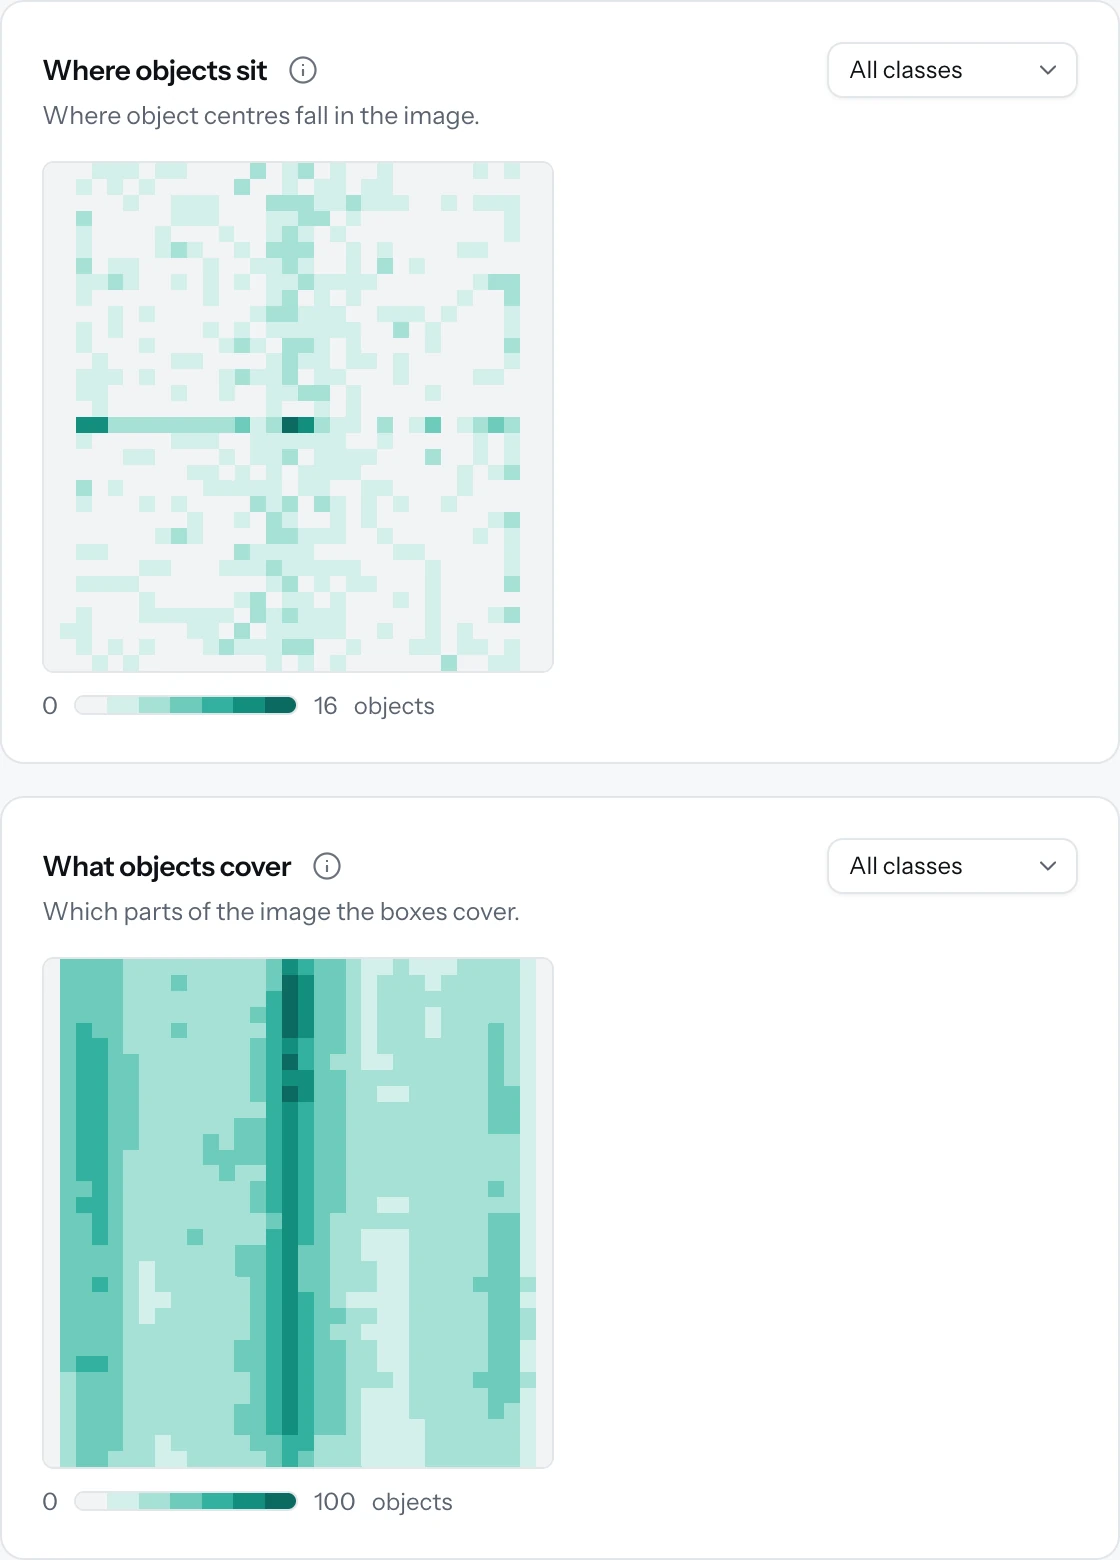
Heat maps of the defect centers and of the areas their boxes cover on the board
Where the defects appearWhere the centers of the defects on 483 boards fall and which areas their boxes cover: the streaks run the board from top to bottom.
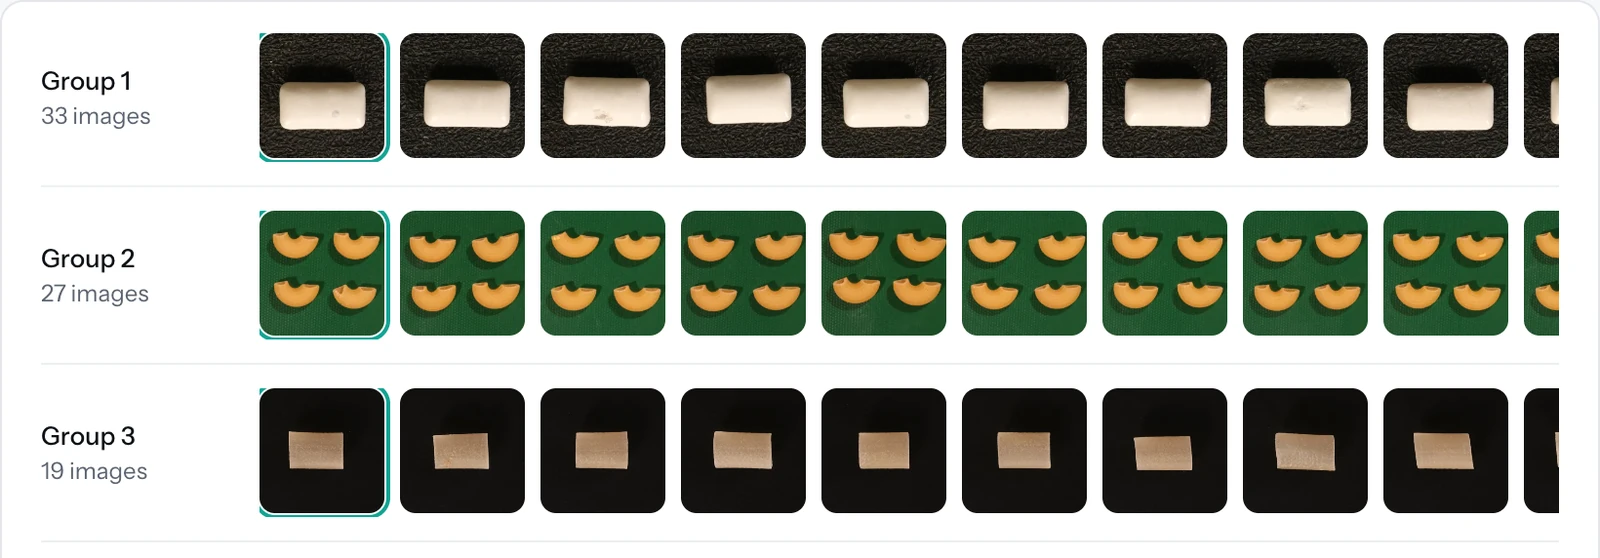
Duplicates: three groups of near-identical photos of chewing gum, snacks and macaroni
Near-identical imagesGroups of near-identical photos of the same part, which must not be split between training and test.
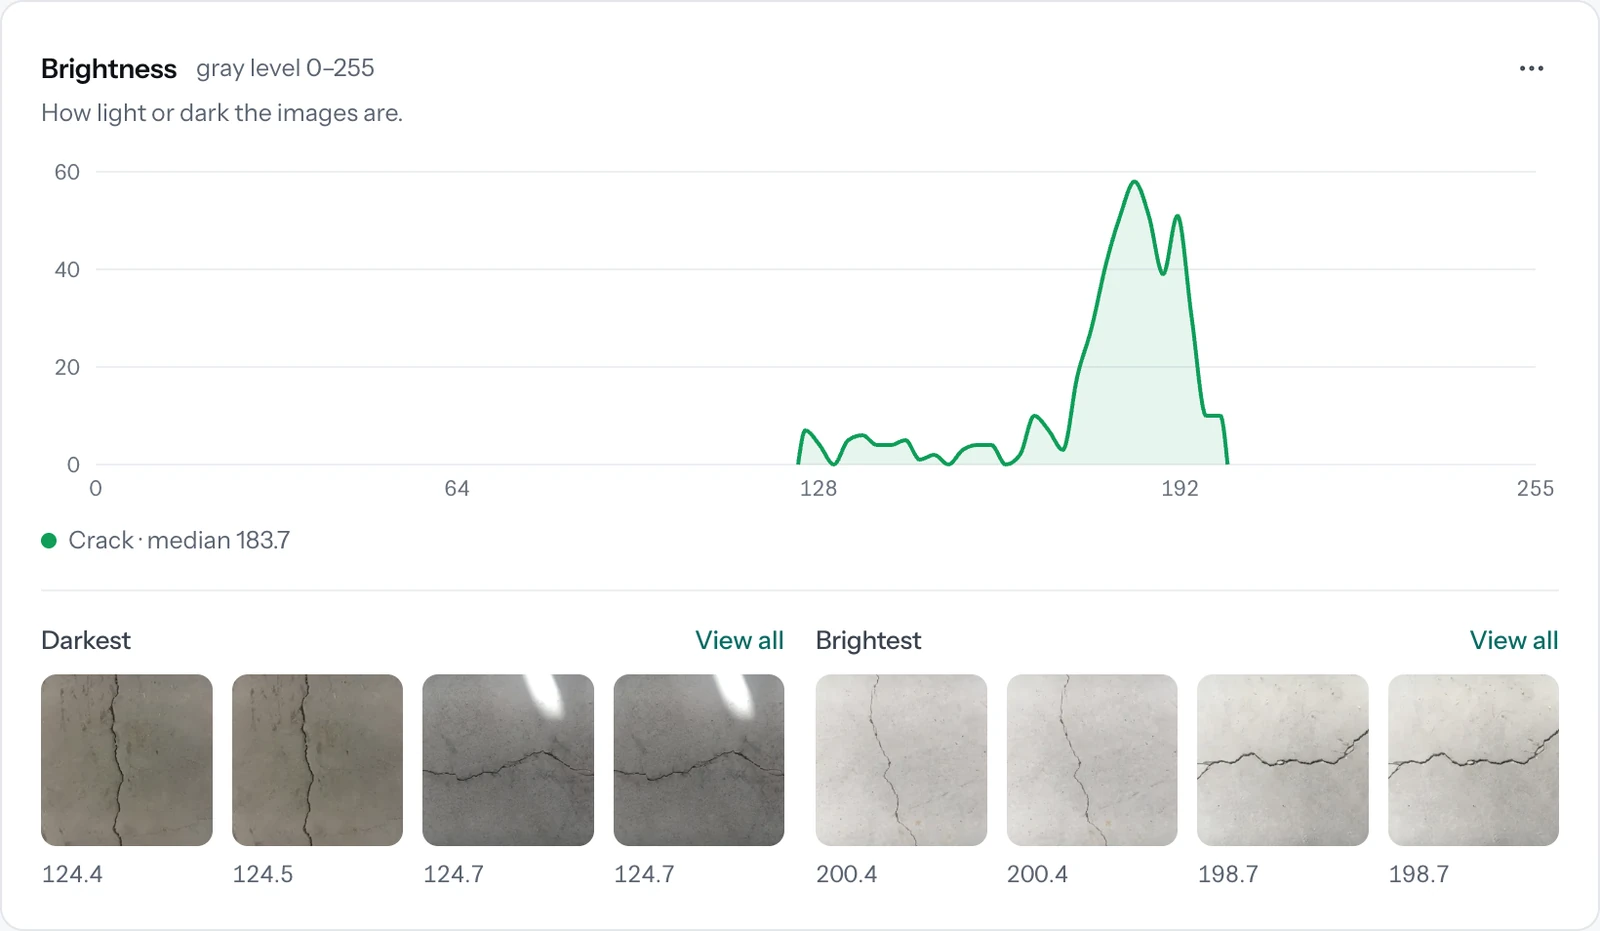
Brightness distribution of the concrete photos, with the five darkest and the five brightest
Brightness, contrast and sharpnessThe distribution of each measure, with the images at both ends to see what is behind it.
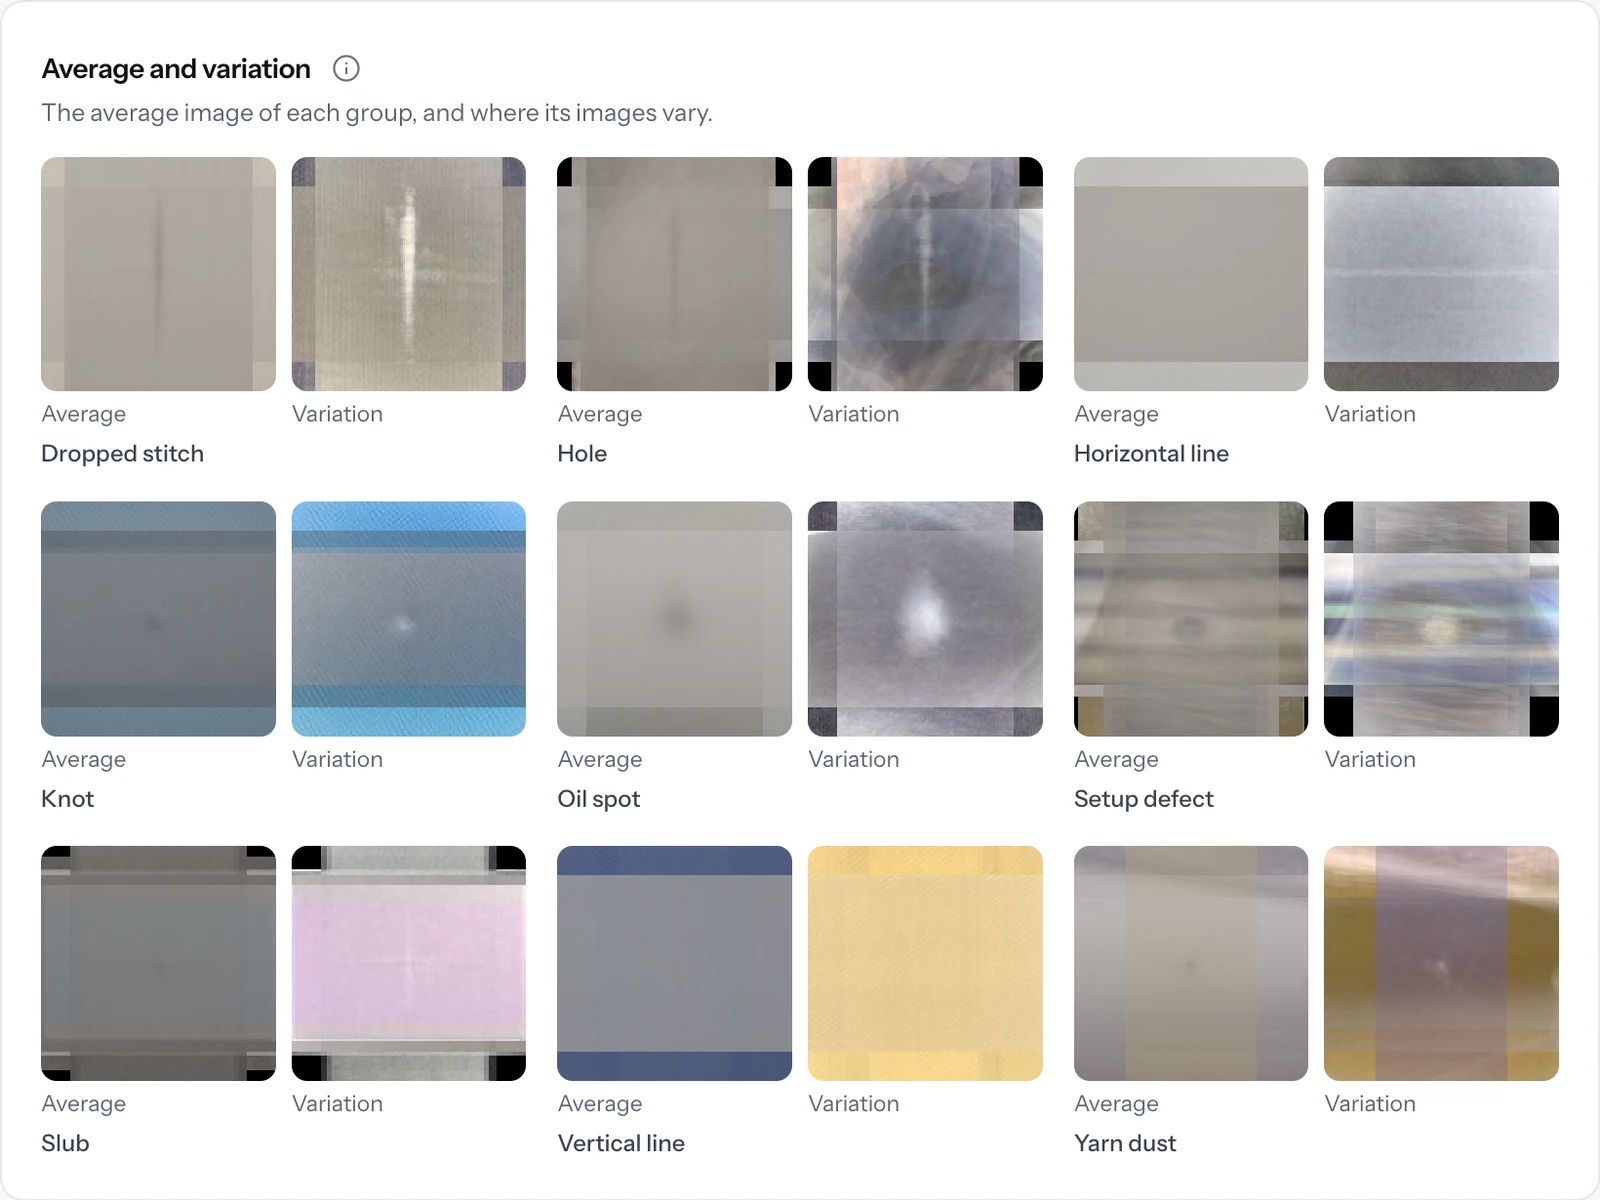
Mean and variation of each fabric defect class: a mean image and a variation image per class
Mean and variation of each classIf a class has another background or light, it shows at a glance: here each class carries the color of its factory's fabric.
Augmentation screen of a segmentation project: nine variants of a concrete photo with the crack marked in green What the model sees: the original board, the model input at 384 pixels and an augmented variant, with the share of defects under 8 pixels for each input size
Real video: from the Normal recipe to the Strong one on a board with nine defects; the boxes follow every variant.

Step 4 · Data augmentation

More variety, without taking more photos

During training, Ocelo makes variants of each image: other lighting, the part rotated or shifted, some blur or noise. That way the model learns the defect, not the particular photo. Ocelo suggests a recipe for the task and shows right away what the model will see.

  • Light, Standard and Strong recipes, or your own, operation by operation.
  • Geometry, color, blur and noise, each with its own strength.
  • Boxes, outlines and masks follow the image in every variant.
  • “What the model sees”: the image at the real input size, and how many defects would be too small.

Step 5 · Training

State-of-the-art models, without writing code

Ocelo proposes the model for the task and explains why: DINOv2, ConvNeXt, RF-DETR, U-Net and other reference models, ready to fine-tune on your images. A first baseline arrives in seconds; then, fine-tuning on cloud GPUs.

  • Classification with DINOv2, ConvNeXt, EfficientNet or ResNet.
  • Detection and instance segmentation with RF-DETR; semantic segmentation with U-Net and FPN.
  • Training runs you can pause, launch in batches and compare.
  • Each training run keeps its data version, its recipe and its environment.
Choose a model window: the recommended model, with its size, speed and why it fits the project Training screen: the list of the project's training runs with their model, duration and result Training run screen: loss and metric curves per epoch Models screen: the models with their family, size, speed, parameters, year and task
Real screenshot: Ocelo recommends a model for the project and explains why.

Step 6 · Evaluation

Validate the model you will use, not another one

Ocelo evaluates the exact file that is delivered and compares it with your acceptance criteria. If something is missing, it says so: how many defects could slip through, on which products, cameras or batches it fails most, and whether the model's confidence can be trusted.

  • Confusion matrix, per-class metrics and decision threshold.
  • Errors by product, folder, camera or week, with their significance.
  • A downloadable acceptance report, with data, metrics, limits and signature.
  • A card for every model, and model comparisons.
Confusion matrix screen: hits and misses for OK and NOK Weak groups screen: the error rate of each product with its interval, with capsules flagged as the worst group Per class screen of a detector: precision, recall, AP50 and F1 for each wood defect class Try it screen of a segmentation model: the predicted crack, in green, on a concrete photo Threshold screen: histogram of scores with the threshold marked Model card screen: the model's identification, data and metrics
Real screenshot: the confusion matrix shows the images behind every cell.
An Ocelo deployment screen: today’s images, latency, the line PC’s connection and its runtime Monitoring screen: images of the last seven days, NOK rate, uncertainty and drift, with camera 2’s alert Drift screen: camera 2’s unusual images per day and its brightness, contrast and sharpness statistics, with alerts on the last day Samples screen: production images of several products marked “Unsure” Try it screen of a detector: a wooden board with five defects found, each in its box with its class and confidence
Real screenshot: the model of an example packing line on a plant PC, with today’s images, the latency and the connection.

Steps 7 and 8 · Deployment and monitoring

From model to line, and watched

Publish the model as an API, or take it to a shop-floor PC with the edge runtime, offline too. In production, Ocelo watches whether the images change and when the model is unsure; every retrained model is compared with the one in use before it replaces it.

  • A REST API per deployment, with revocable keys and usage limits.
  • An edge runtime in Docker: it switches models without stopping and syncs over HTTPS or USB.
  • A standalone ONNX package to build into your own software.
  • A Python SDK and call examples in five languages.

Trust

Your data and your models are yours

Your own instance in the EU

Every customer works in their own Ocelo instance, isolated from the others and hosted in the European Union.

Open formats

Export images and labels as COCO, YOLO or PNG masks, and models as ONNX with their manifest. Nothing gets locked in.

Traceability

A chained, verifiable audit log, admin, reviewer, annotator and viewer roles, and a card for every model.

Backups and security

Daily encrypted backups with tested restores, encrypted connections and a server with no ports open to the Internet.

Reusable kits

A solved case is saved as a kit: classes and criteria, capture guide, acceptance criteria, recipe and base model. The next project starts from there.

On your servers too

Ocelo Local is the same tool installed at your company, even without an Internet connection.

Activity screen: the project’s events, each with its person, category and fingerprint, and “Integrity verified”
Real screenshot: the activity log, chained and verified, with the fingerprint of every event.

Shall we try it on your images?

Tell us what the part is and what defect you are looking for: we will tell you whether Ocelo fits and how to start.